

 The past decade has brought long overdue attention to the large racial/ethnic wealth gaps in the U.S. In 2021, Black families held 23 cents in wealth and Hispanic families held 19 cents in wealth for every dollar held by white families, on average. Cities and counties across the country are exploring how public policies and private actions within their jurisdictions have contributed to these gaps. Locally, King County’s Wastewater Treatment Division (WTD) tasked ECONorthwest (ECO) with assessing the impact of race-based restrictive real estate practices on homeownership rates and intergenerational wealth for BIPOC residents of King County. Those practices, past and present, include deliberate racist policies like redlining, racial deed restrictions, and discrimination in appraisals and lending practices.
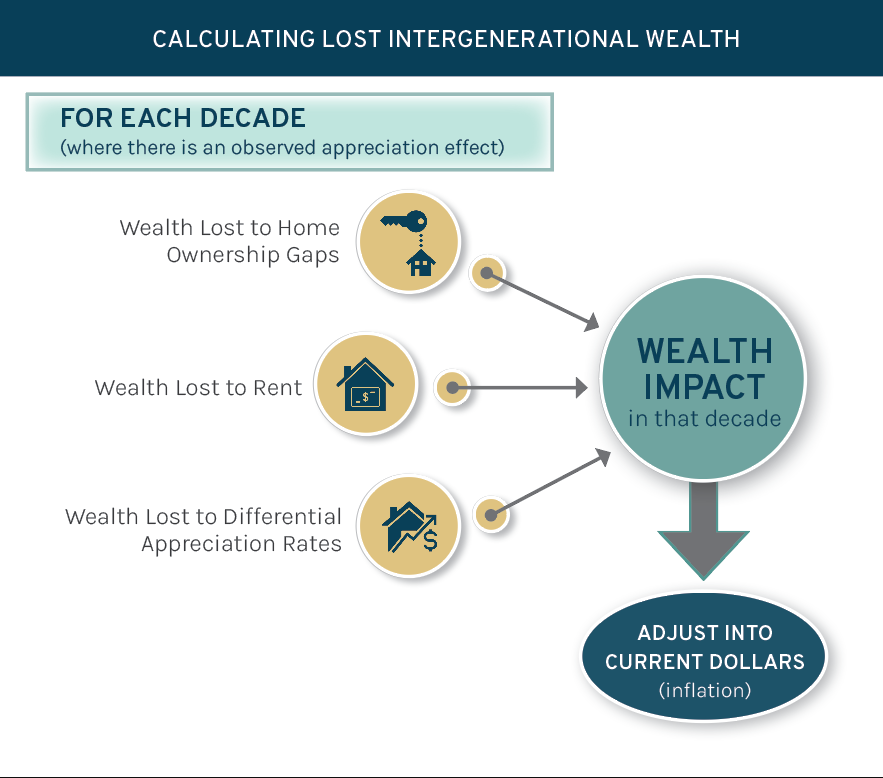
To calculate the impacts of those practices on BIPOC household wealth, ECO started with a key assumption: absent racial discrimination, BIPOC and white homeownership rates would have been equal during the past 70 years. We further assumed that BIPOC homeowners would have experienced price appreciation on par with homeowners who lived in income-matched, majority-white neighborhoods. Finally, we assumed BIPOC homeowners—like their white counterparts—would have accrued wealth gradually by making monthly mortgage payments and reinvesting their assets into wealth generating investments, like the stock market. Taking these three elements together—higher homeownership rates, improved price appreciation, and equity accumulation:
ECO estimates King County’s BIPOC households would hold between $12 and $34 billion in additional wealth today. The average forgone wealth translates to a range of $105,000 to $306,000 per Black household and between $32,000 and $85,000 per other non-white household (2019 dollars).
What do the homeownership data show?
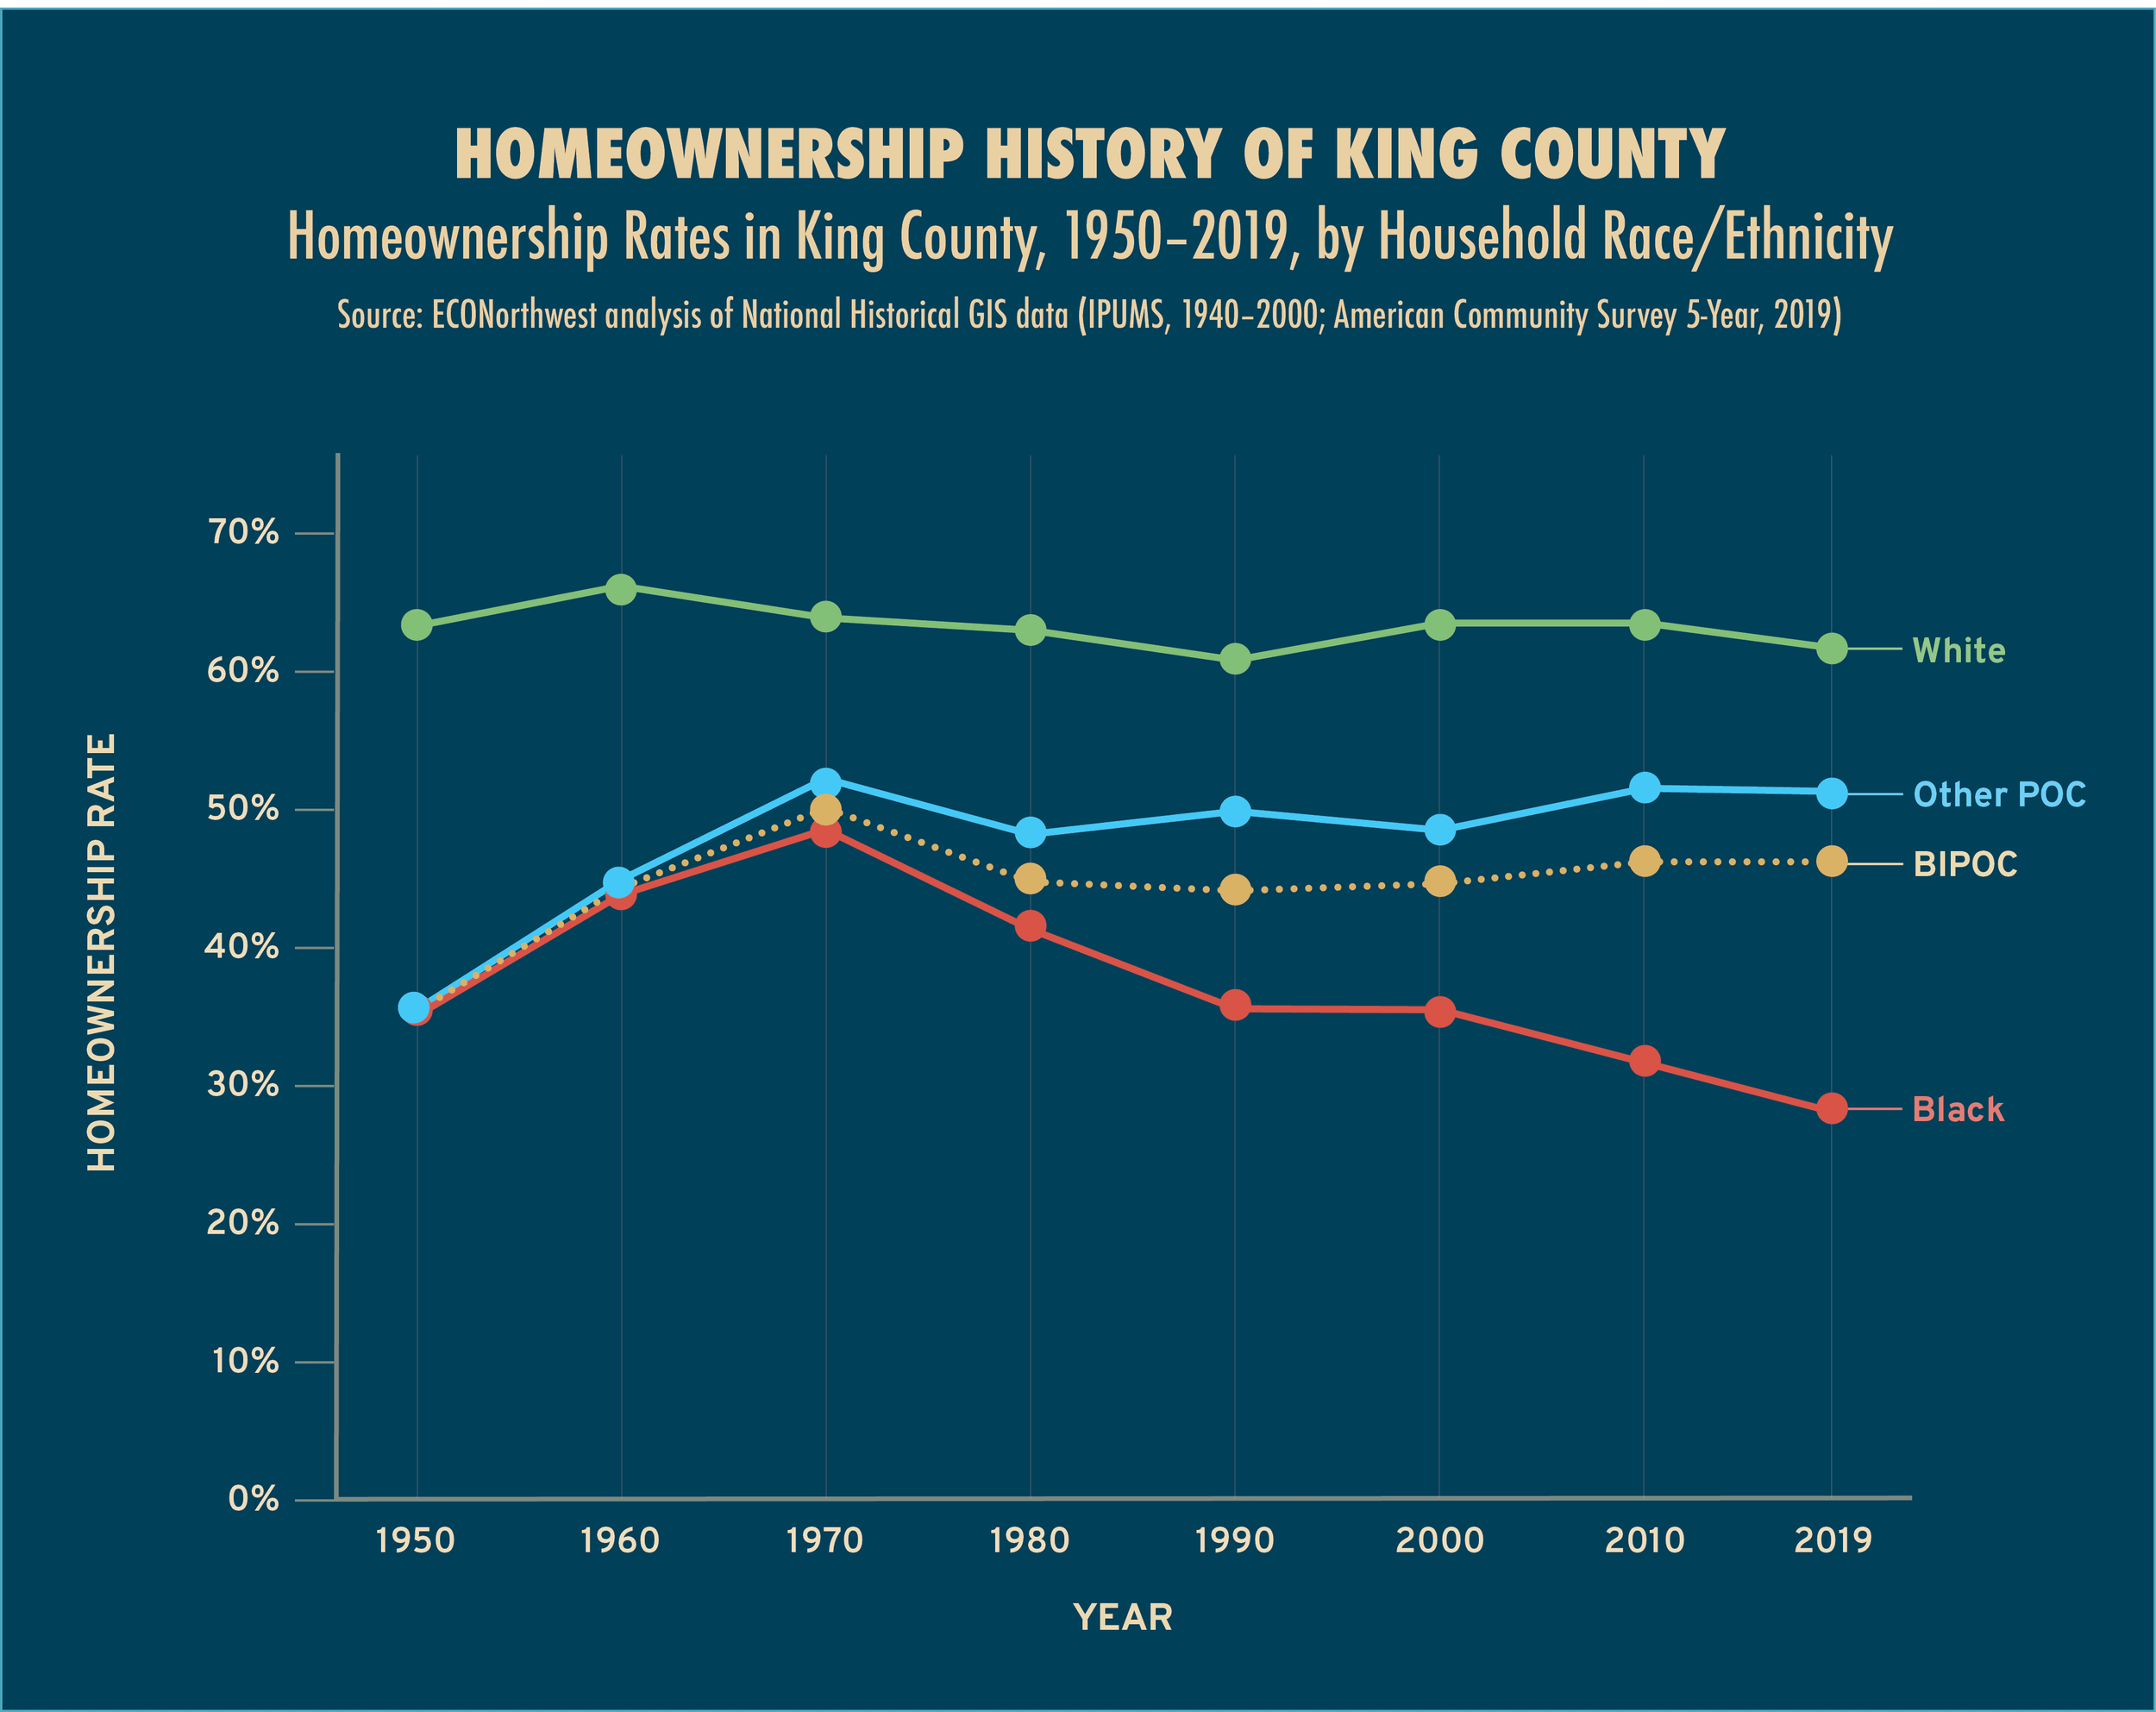
Racial/ethnic gaps in homeownership rates have been sizable in King County throughout the past 70 years (and certainly before). The BIPOC-white gap stood at nearly 30 percentage points in 1950—a legacy of 1920s era redlining, racial deed restrictions, and other explicitly racially discriminatory policies. The homeownership gap closed during the next twenty years thanks to the region’s broadly shared economic growth, home prices that—relative to today—were better aligned with incomes, and a reversal of discriminatory policies. But during the subsequent 50 years, progress on the BIPOC-white gap stalled and the Black-white gap widened—and it is now larger than in 1950. Several policies from the post-1970s era contributed to the BIPOC ownership challenge, including single-family zoning, urban renewal, gentrification, and a host of other regulatory and process barriers that have led to the underproduction of housing.
For the purposes of this chart:
—”BIPOC” includes all non-white racial categories (including residents who are Black, Indigenous, Hispanic/Latine, Asian, and all other minoritized groups that do not identify as white or within the other categories). The dotted line combines “Black” and “Other POC” data.
—”Other POC” (people of color) encompasses all racial categories except for Black and white.